
From knowing the field to precision fertilisation
PrecisionFert turns soil and climate data, together with information gathered during the growing season, into prescription maps that make it possible to apply the right fertiliser rate in each zone of the field.
Agronomic metamodel
A model processes soil characteristics, weather data and crop information to estimate nutrient requirements across the different areas of the field.
Canopy vigour estimate
Satellite and drone imagery, or multispectral sensors mounted on farm machinery, make it possible to monitor crop status through the season and identify differences in vigour within the field. This information is used to fine-tune nitrogen fertilisation management.
Building the prescription map
The system combines the agronomic model output with crop vigour indicators to define site-specific fertiliser rates, producing a map ready for variable-rate application.
Variable-rate application
The prescription map is transferred to the machine’s guidance and control system, which automatically adjusts fertiliser output according to the rate defined for each area of the field.
Different nutrients, different management strategies
Precision fertilisation requires different approaches depending on the properties of each nutrient and on how it behaves in the soil-plant system.
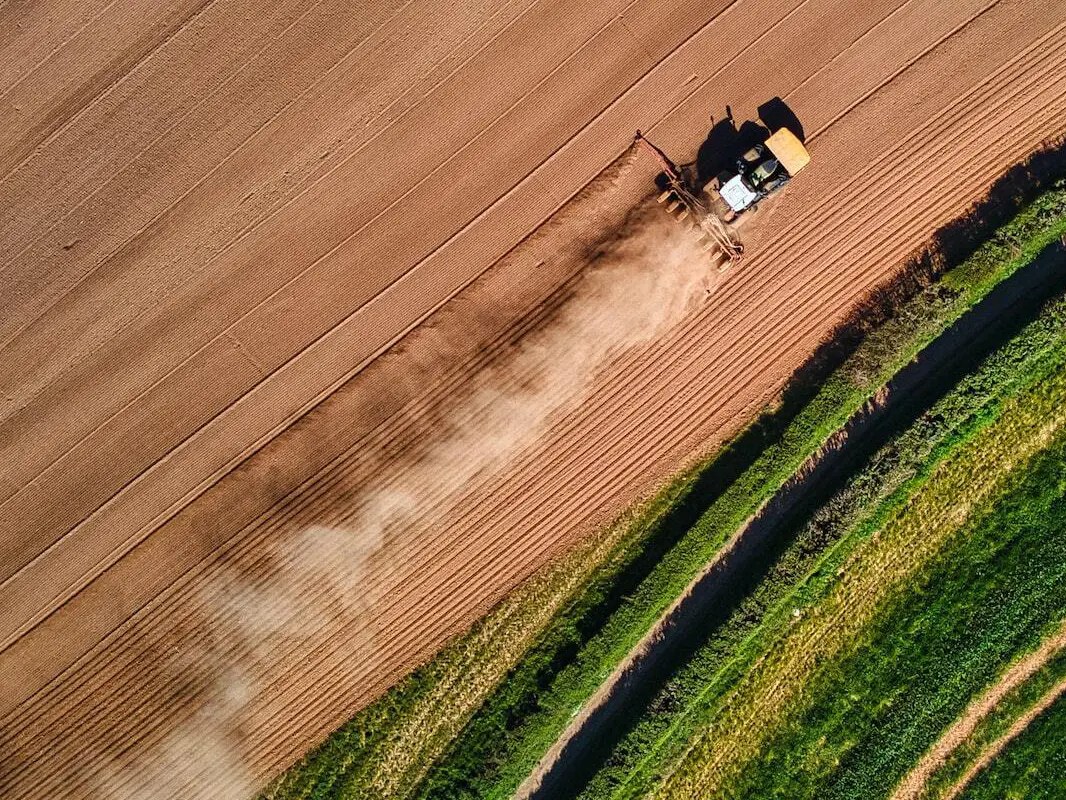
Nitrogen is closely tied to crop development and environmental conditions. For this reason the requirement estimate is updated during the season, combining agronomic models with crop status information obtained from satellite imagery, drones or proximal sensors.
Phosphorus and potassium are more stable in the soil, and their availability varies mainly across space rather than over time. Management is therefore based on characterising soil properties through georeferenced sampling, used to map the variability of the different areas of the field.
The repository connects every stage of the process
Today the functions of the SmartFit DSS are spread across separate applications that do not share information automatically. The repository creates a common database linking all the modules of the system, automating the flow of information and ensuring data continuity and traceability.
retyped by hand
retyped by hand
The repository will make it possible to draw on public data (such as the ARPAV soil maps) and combine it locally, on the farmer’s own computer, with farm data to produce useful information. The results remain visible to the end user alone: the farmer does not share private data, but uses it alongside public data and tools.